Eating our dog-food or its fancier form drinking our own champagne are metaphors commonly used in the software industry to describe when an organisation uses its product. Donald Knuth, regarded by many as the godfather of computational complexity, well-described how dog-feeding played a crucial role in the development of his typesetting software now extremely popular among STEM academics.
Thus, I came to the conclusion that the designer of a new system must not only be the implementor and the first large-scale user; the designer should also write the first user manual. […] If I had not participated fully in all these activities, literally hundreds of improvements would never have been made because I would never have thought of them or perceived why they were important.
Donald Knuth
As some of you may know, I work in data science and software engineering. So, I decided to dog-feed me data science. For those of you that are still wondering what data science is, Wikipedia puts it nicely: data science is a multi-disciplinary field that uses scientific methods, processes, algorithms and systems to extract knowledge and insights from structured and unstructured data. But how to consume this myself? Let me show you what happened in practice.
Data collection
Garbage in, garbage out is another common saying in computing. It describes the idea that low-quality input produces erroneous output, despite how it is processed. To put this in perspective, let me reveal you the surprising outcome of the equation crappy data + very expensive data scientists = nothing, no insights, knowledge or results.
Back to my dog-feeding problem, here is the data I managed to put together about myself:
- Apple health data such as sleep time, daily steps and storeys climbed.
- Events from my personal and work calendars.
- My bank transactions
- My daily moods and activities recorded with Daylio
- Self-recorded scores of how bad I felt about topics that made anxious
Despite their diversity and granularity, something ugly about the data I collected is their differences in start time, which look like this:
| Data source | Start date |
| Apple health | January 15th 2018 |
| Calendar events | January 13th 2016 |
| Bank transactions | December 7th 2017 |
| Daily moods | February 23rd 2019 |
| Anxiety scores | July 5th 2016 |
Sadly, the limited temporal overlapping between data sources implies limited validity between the comparisons among them. Especially limiting is the shorter period of reported daily moods.
Exploratory analysis
After parsing and processing the data, which took me no more than a couple of hours per data source, I started exploring the freshly compiled dataset. Exploratory data analyses can sometimes feel like when we land in a foreign city for the first time and stroll around trying to orientate ourselves.
Exploring my anxiety scores, I noticed a few things:
- my anxiety about interactions with men reduced over the last 3 years;
- my anxiety about romantic relationships also reduced but less drastically and it peaked last July when I had some conflicts with my partner;
- my work anxiety peaked last April when I resigned from the company I co-founded.
Another thing that peaked in late March / early April last year is the number of work events in my calendar. May this be related with my consequent decision to resign?
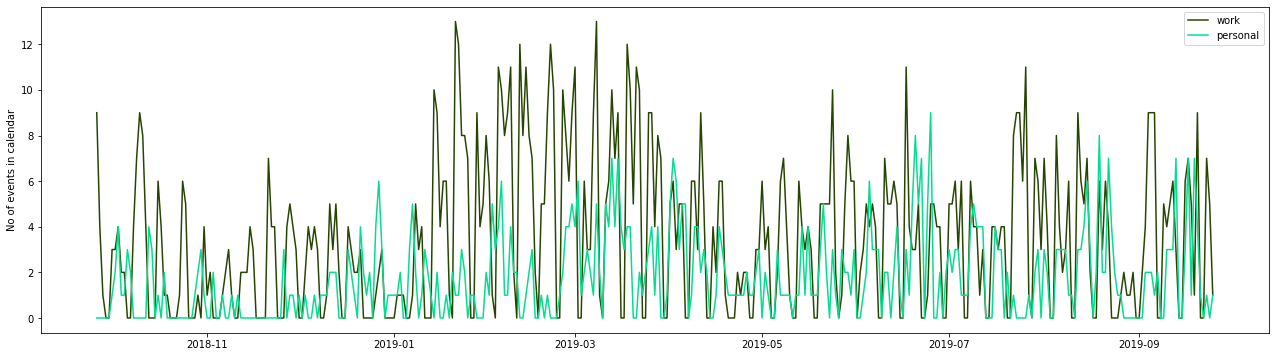
Regarding calendars, I also looked at the length distribution of both work and personal events.
| Event length in minutes | % of work events | % of personal events |
| 0 – 15 | 12 | 14 |
| 15 – 30 | 25 | 20 |
| 30 – 45 | 5 | 4 |
| 45 – 60 | 28 | 25 |
| 60 – 90 | 7 | 5 |
| 90 – 120 | 5 | 6 |
The similarity between work and personal event lengths makes me think that either my personal life is too corporate or that my work is organised without too much unnecessary bureaucracy, despite the British chit-chat at the beginning of meetings. Hopefully, the latter.
My median sleep is 7.5 hours and my median number of steps per day is 7222. This means that on average.

On the financial front, excluding large transactions (above 300£), I spend on average 15£ per day with a median value of 10£.
Inference
Exploring data is relatively easy when compared to extracting knowledge from it. Computers are not yet able to find the right questions to ask, and data won’t speak to us by itself. Even for us humans, asking questions to the data is hard. First, we need to ask good questions, but what is a good question? In his TED talk, David Stork explains that good questions are unambiguous and answerable, go to the hearth of the problem and lead to new questions. Once we have a question to ask, we need to take into account possible hidden effects. Here are the questions I asked the data about myself.
1. Are there cycles in my anxiety levels?
This is an important question for me as he presence of a clear cycle in my anxiety levels could enable me to prepare for it. To answer this question I looked at autocorrelation and partial-autocorrelation plots. The first plots the correlation between the value at each day and the value at each n days before. That is, if today and last month values are very correlated, this may indicate the presence of a monthly cycle. Partial-autocorrelation looks at the same thing but after removing the effect of any correlations due to the terms at shorter lags. That is, if there is a 5-days cycle it will remove the 5-days effect from a 10-days cycle.
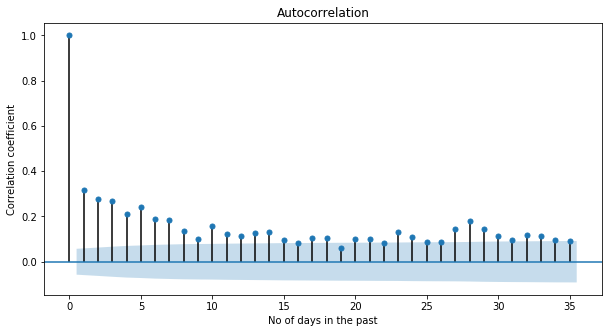
The graph shows no significant autocorrelation suggesting the absence of any clear cycle. The same pattern holds for other anxiety measurements, longer lags and partial-autocorrelation plots.
2. Does the time I go to bed influences my mood the next day?
In order words, this question asks if, provided enough sleep, will I feel happier by waking up earlier. To answer it, I had to do some interesting modelling on my data since the time of the day cannot be used out of the box. Why? Well, 23:30 and 00:00 are very similar times, but not if we treat them as 23.5 and 0. Thus, I projected time of the day to a circle and extracted the sine and cosine for each time. I then decided to answer this question by seeing if I could predict my mood on the sole basis of these two values (i.e. sine and cosine of sleep time). Interestingly, any predictive algorithm I tried (logistic regression, random forest classifier and others) could not perform any better than a dummy classifier that predicted the most common mood every time. Most likely, the time I go to bed does not affect my mood the next day.
3. How does drinking alcohol affect my mood?
Tricky question: drinking may make me more social but is also a known depressant. First I looked at my self-reported mood scores for when I drank and not, both for the day when I drank and the day after.
| Average mood / Condition | Drank | Did not drink |
| Day of activity | 4 | 4.14 |
| Day after after | 3.8 | 4.15 |
The non-drinking days align with my general average mood that is 4.13 out of 5, but the drinking days fall short of the mean. This seems to discourage drinking, with the caveat that I have only ten drinking days in my data. However one may argue that I am jumping to conclusions. What if there are other activities that I do every time I drink and are those activities that affect my mood? Such activities would be a so-called confounder. Inspecting the data, I can see that out of the ten times I drank seven times I had work meetings.
| Average mood / Condition | Had meetings | Did not have meetings |
| Day of activity | 3.99 | 4.23 |
| Day after activity | 4.09 | 4.16 |
Aha! So are meetings or drinks affecting my mood? Time for heavy data science weapons: causal inference. Causal inference is a relatively young branch of statistics, popularised Judea Pearl. To run causal analyses and answer the above question I used the DoWhy package by Microsoft.
While accounting for meetings as a confounder, I estimated a causal effect of -0.065 on my mood due to drinking. It did not have statistical significance (a p-value of 0.35 using linear regression as causal estimand) and I was able to refute the estimate replacing the treatment with a random placebo effect. The analysis of the effect of drinking on my mood the next day, however, reported a causal estimate of -0.42 with a p-value of 0.055 and greater resistance to estimate refuting. Also, the same analysis performed for the effect of work meetings on my mood did not show any significant effect. Thus, the answer is that drinking negatively and significantly affects my mood on the day after I drank.
4. How does spending money affect my mood?
Answering this question requires cross-checking my mood and spending data. First, I had to treat outliers. I removed all days in which I either did not spend any money at all (later I tested this choice) and the days in which I spent more than 100£ which appears as clear outliers when plotting the values. I then looked at the median spending by mood score, which seems to imply that lower spending comes with higher mood.
| Mood score | No. of occurrences | Median spend |
| 1 | 1 | 11£ |
| 2 | 2 | 21£ |
| 3 | 23 | 21£ |
| 4 | 90 | 15£ |
| 5 | 43 | 16£ |
However, given the differences in the number of occurrences per mood score and the possibility of hidden effects, I wanted to test this more thoroughly and decided to apply proper causal inference. To do so, I had to find a binary treatment (yes/no) variable so I decided to test the causal effect on my spending of reporting a mood score higher than 3 controlling on the day of the week and the month of the year. Using a propensity score stratification estimator, which is a straightforward application of the back-door criterion, it estimated a causal effect of -12.5. This implies that when my mood score is higher than 3, I will likely spend around 10£ less. Furthermore, the causal estimate resisted to all causal refuter techniques. To finally prove the point, I tested two more things. First, I estimated the opposite effect with the same methodology, that is the effect of spending more than 20£ (I tested this with 30£ as well) on my mood score and obtained a sound 0. Second, I reproduced the above steps without excluding zero spending days, and obtained a causal effect of -15, that, including zero spending days, when my report mood score is higher than 3 this will likely cause me spending around 15£ less. Being happier saves money.
5. Which activities reduce my anxiety?
Once again, I repeated the causal inference above, using my self reported anxiety scores as an outcome, whether I did a certain activity or not as a treatment and tested for all other activities as co-founders. Here are the results of some activities.
| Activity | No. of occurrences | Causal effect | Resists to refutes |
| Meditation | 51 | -0.4 | Yes |
| Walking | 46 | -0.175 | No |
| Social time | 57 | -0.8 | Yes |
| Napping | 29 | +0.1 | No |
| Running | 32 | -0.4 | No |
| Bad sleep | 18 | +0.2 | No |
| Data science | 71 | -0.25 | Yes |
| Coding | 52 | -0.3 | Yes |
| Reading | 34 | -0.5 | Yes |
Considering that my self-reported anxiety level for the tested period has a mean value of 1.15 and a median value of 1, confirmed reductions in the order of half a point are valuable signals. It seems that meditation, socials, doing data science, writing code and reading are all activities that help me managing anxiety.
Conclusions
Eating data science was certainly an interesting experience to teach me more about the value and limitations of this discipline. Here are some final considerations I made:
Data needs intention in the making. It is very hard to extract insights or knowledge from data that was not collected to answer a specific question. Starting from the problem, rather than the data, and collecting data with a purpose in mind simplifies everything. This descends from the scientific method itself and is the science in data science. Data cannot something unless it encompasses the context of interests.
Statistical estimation is fragile. If you torture data long enough, they will speak out what you want. It is sad but is true. The slogan data is better than opinions has its limits. Raw data has no answers, and to get answers we need to slice it, dice it and query it. There are, however, so many different ways to ask a question to the data that we can get many different types and often contradictory pieces of evidence. Trustworthy conclusions hinge on earnest and careful scientific intention, so we probably should not always trust data more than opinions at face value.
Outcome is king. Data alone is useless. What makes it valuable are the questions we can ask to it. As it turns out most of these question focus on some key metric of interest, such as happiness or anxiety. I have over four years of data for some variables, but given that I had only six months of my reported daily moods, most of my analyses focused on this shorter period. This reinforces point one: start from questions, then measure what matters.
Wrapping up this work, I wondered if now that I have analysed all this data, I know more about myself? Interestingly, the analysis busted some myths I believed in, such that my anxiety is cyclical or that waking up earlier makes me happier, which I probably will no longer use as justifications for feelings or behaviours. It confirmed that drinking makes me less happy and now I feel less compelled to drink to enjoy time with friends. I never thought that spending time with friends would make me less nervous, as I believed that it was a trigger, but the analysis challenged this belief. Overall, while when it comes to people is hard to make conclusive statements, I feel that studying this data offered me a new perspective on myself. If you have any thoughts on the methodologies I used, how I used them, the conclusion I reached or my reflections, please share them with me by commenting below. I am eager to learn from my readers.
Leave a Reply